I like analysing #Nifty500 more than #Nifty50 as it always gives a better view of the Market breadth.
The story so far, on Relative Momentum chart.
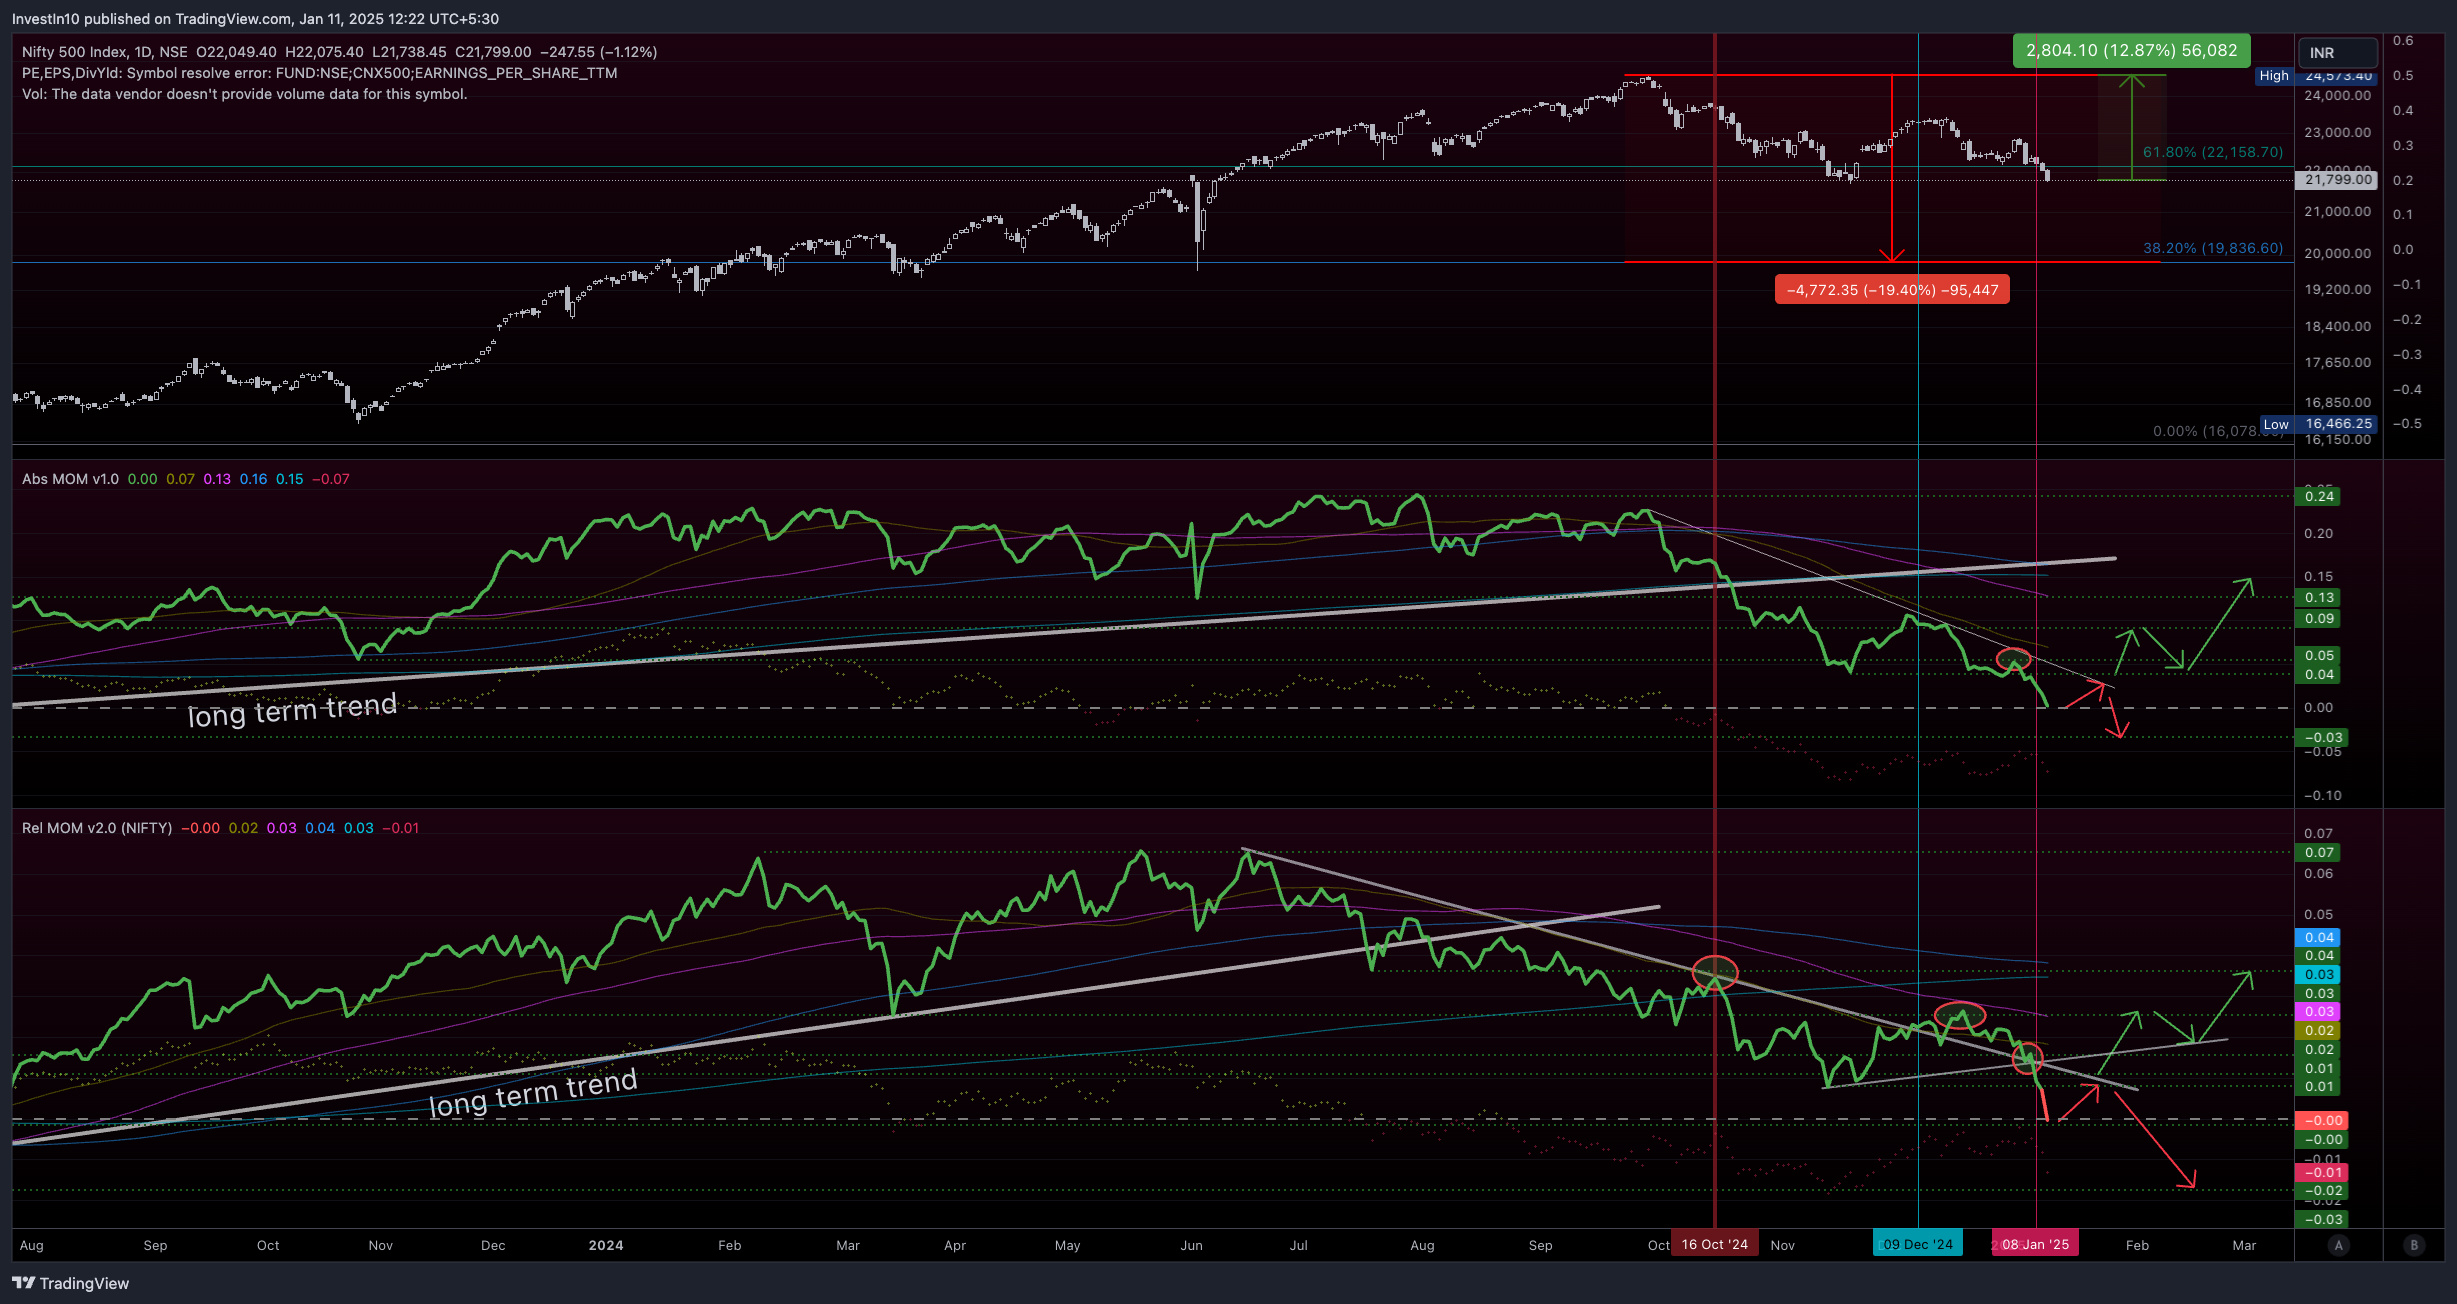


The Bull market was clearly over by 16 Oct ’24, as marked by the dark maroon line.
By 09 Dec ’24, there was a breakout on the Relative Momentum (marked by Cyan line), which made me believe that we might see a resumption in the Bull market.
At this time, my Strategies were filled with Gold & Liquid ETFs. You can check out my Strategy pages for the Historical holding table (everything’s transparent). I scaled into Equity due to this signal on Relative Momentum.
By 08 Jan ’25, the breakout was nullified. This is how things have panned out.
Now, what to expect in the Future?!
I do expect the Nifty500 Relative Momentum to move along the Red arrows, which essentially means that we are in bearish territory.
Zoomed out chart:
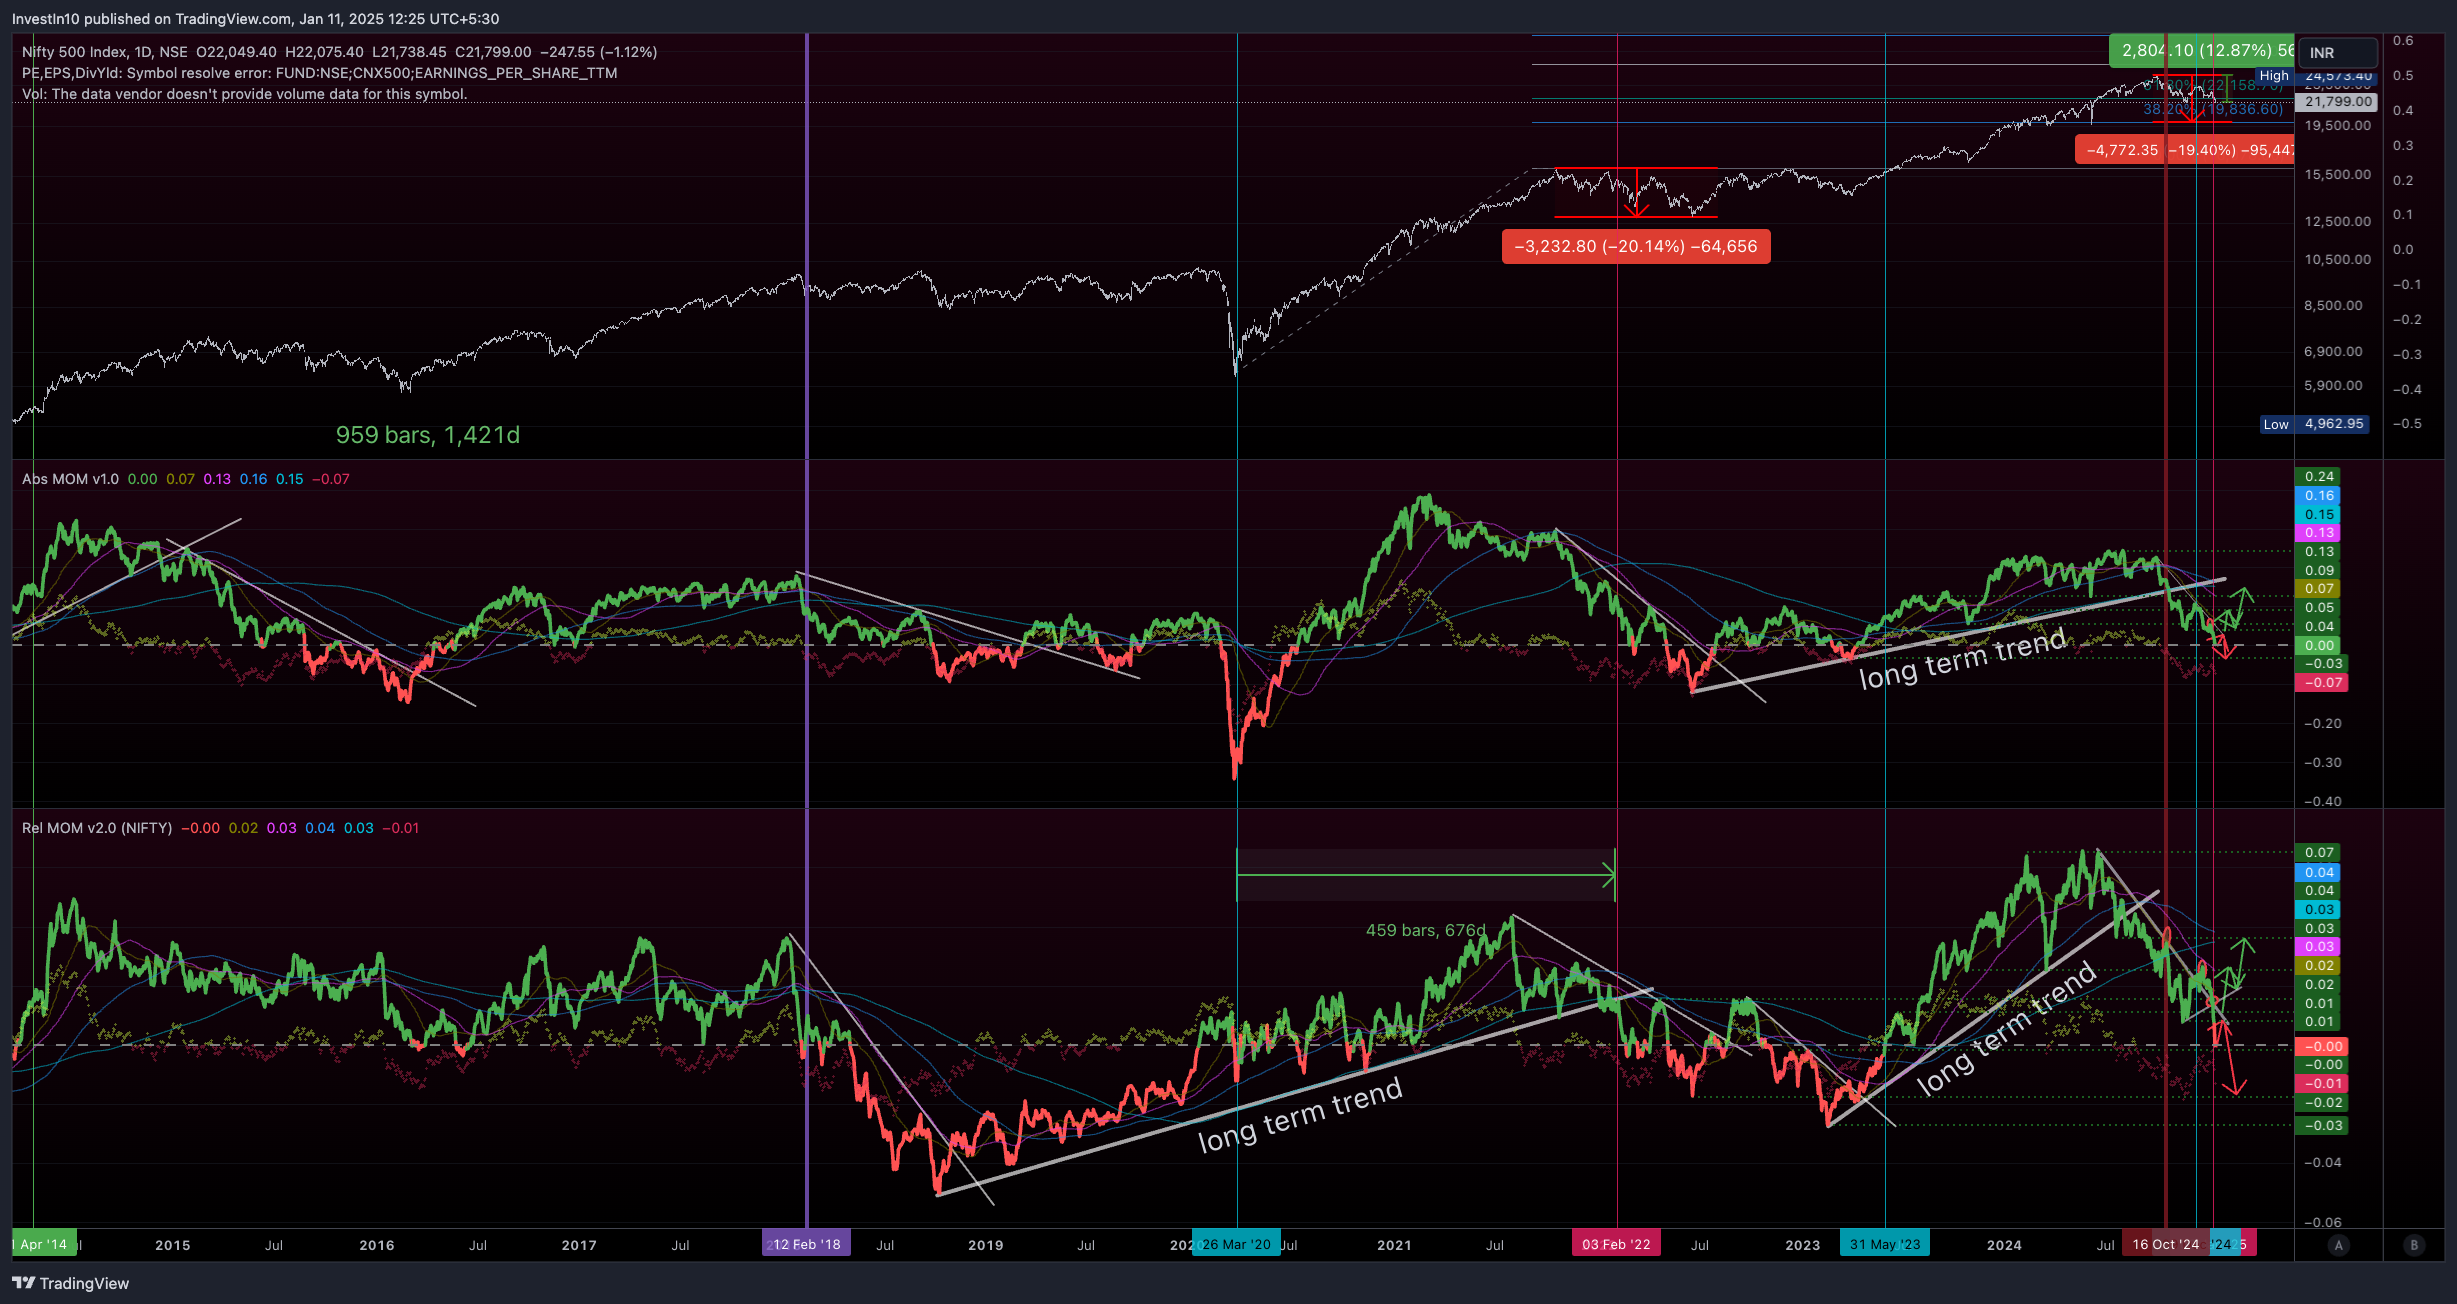
What we might see now could be very similar to what we saw at the start of year 2018. Market participants who were active during that time are very well aware of the painful conditions prevalent.
Leave a Reply