Most of us have the wrong belief that FMCG Sector is a laggard & even if they move, they move slow. Only part of that statement is true, they do move slow when observed over short durations of time only.
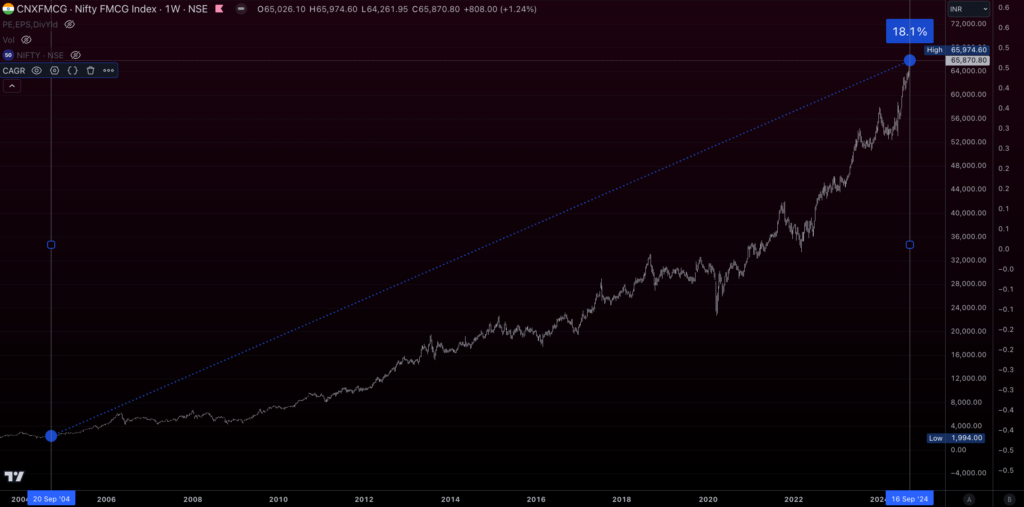
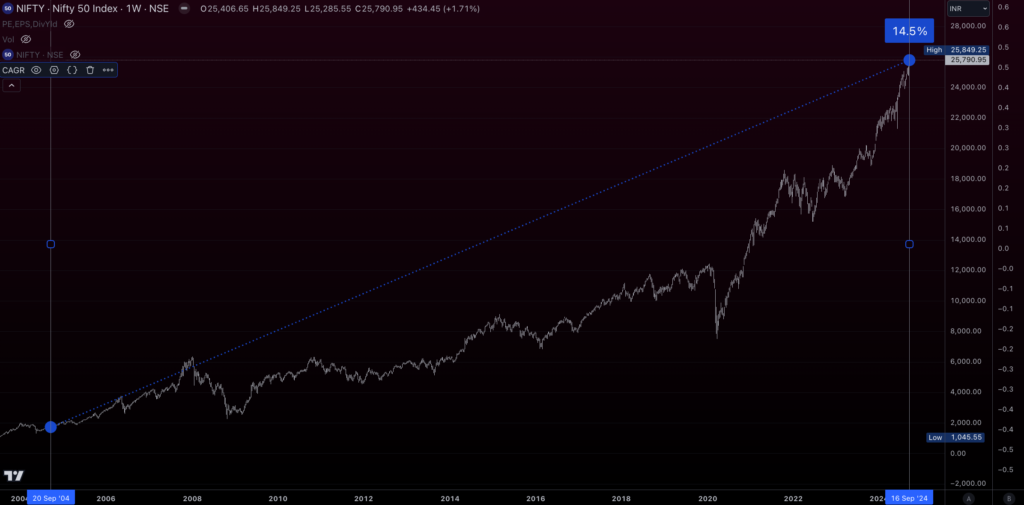
Let me present some facts, below is the 20 year CAGR chart for NiftyFMCG & Nifty50.


Now, let’s look at the historical charts on how Relative Momentum Indicator could have helped in understanding the periods of Outperformance in NiftyFMCG sector.
Aug 2004 – 2 year of outperformance

FMCG sector beat Nifty50 by more than 50% in less than 2 years.
Feb 2008 – just before the famous crash
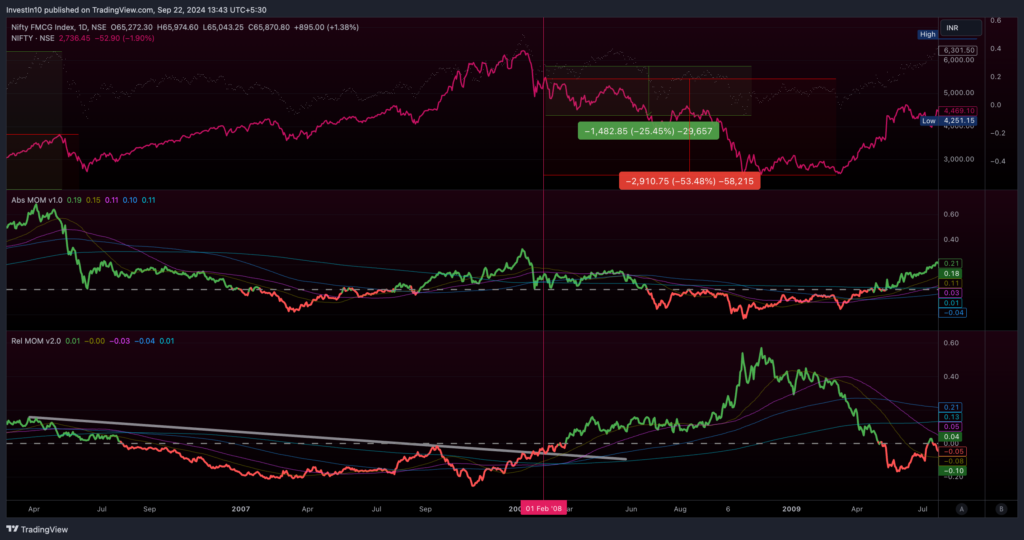
FMCG outperformed the Nifty50 during the crash. FMCG sector Index fell only by 25% as against the 52% crash in Nifty50. Which is outperformance too.
2020 – Covid crash
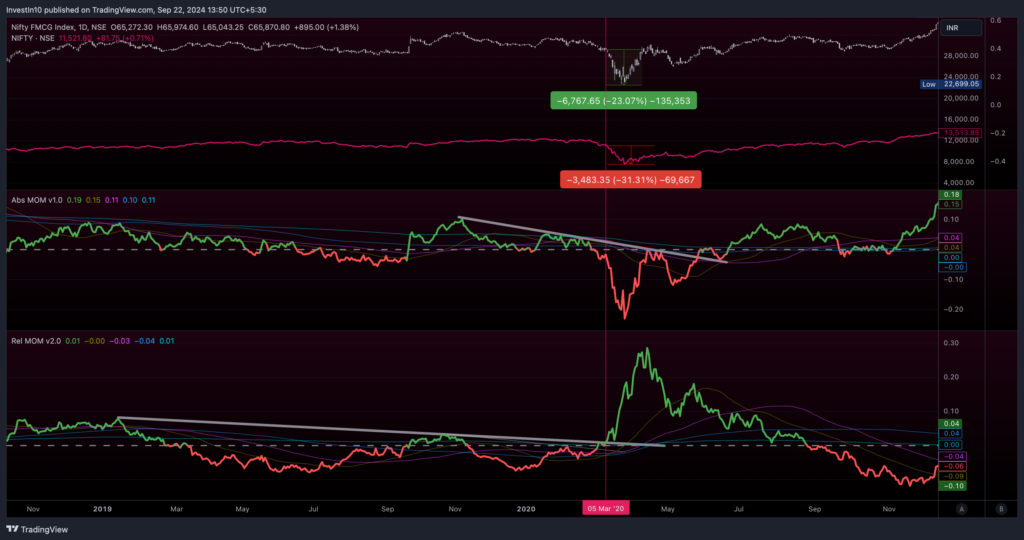
The Relative outperformance by NiftyFMCG during Covid was short-lived.
Current NiftyFMCG Momentum Chart structure:
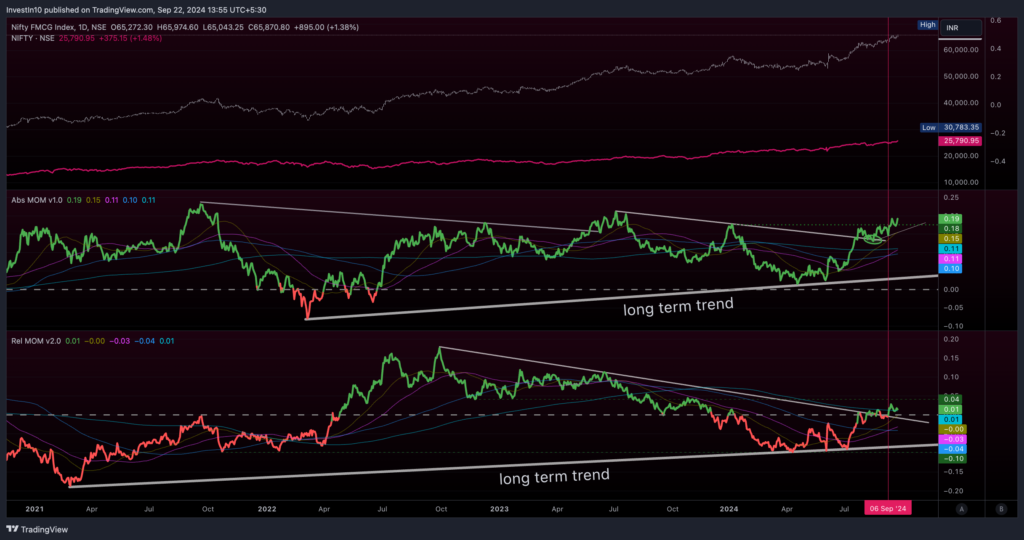
NiftyFMCG is clearly outperforming the Market (Nifty50). We have also established that, it is not always necessary that the Market should crash when NiftyFMCG outperforms.
In the coming days, will be actively looking out for the best stocks in this sector & scale up on them.
Leave a Reply