Industry Indexes considered:
- Marine Ports & Services
- Hotels
These Industries are taken as an example, the analysis is valid for any stock or index.
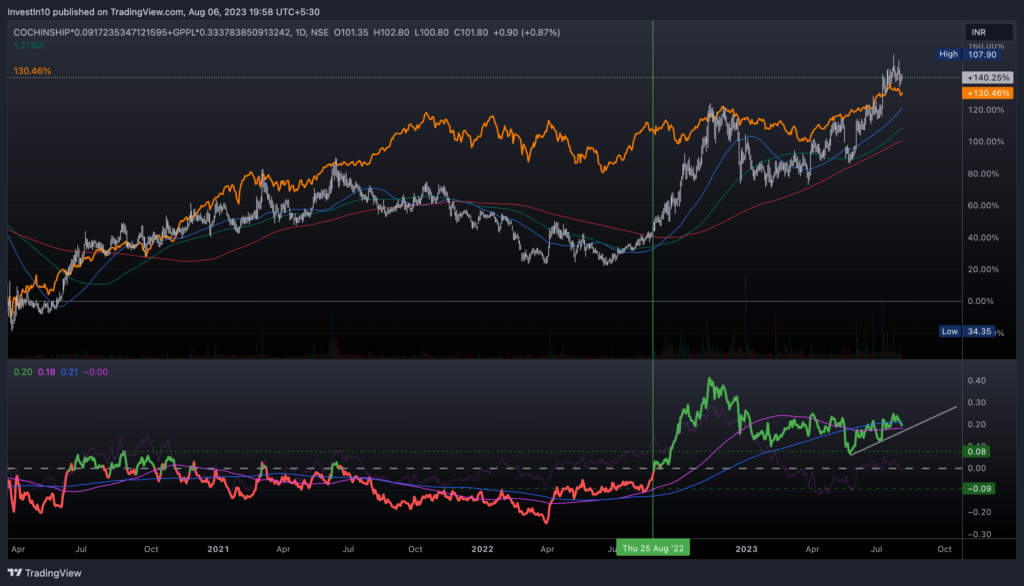
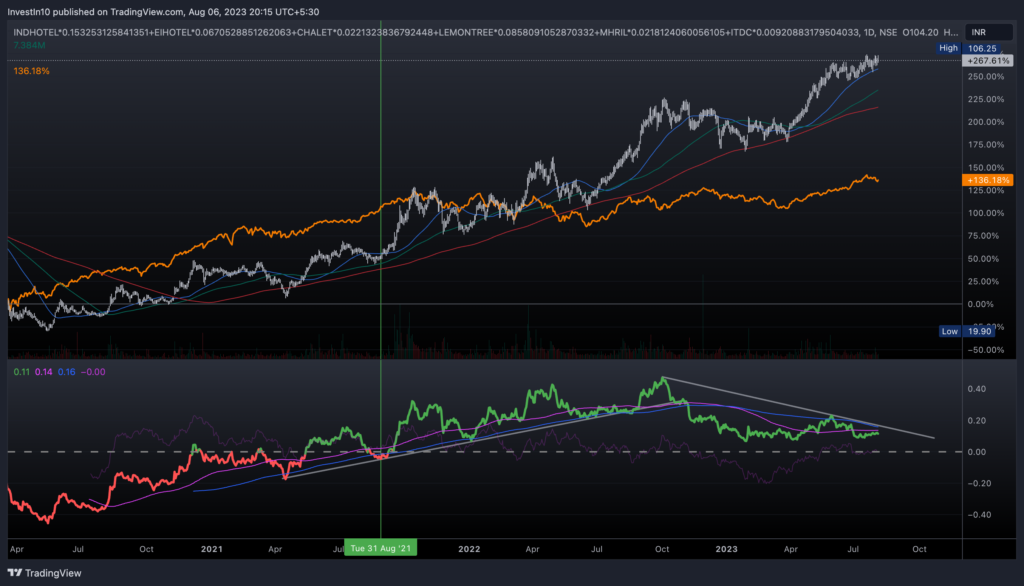
Orange line -> Nifty50 Index
Bottom Red & Green line -> Relative Momentum Indicator
The charts above are started from Covid Bottom -> Apr 2020
Some Salient points from the above charts
- Both, Marine Industry Index & Nifty have given about 130-140 % returns
- Most of the returns from Marine Ports & Services have come from Aug 2022
- Between Jun 2021 & Aug 2022, one would have been better off being invested in Nifty50 or Hotels Industry stocks to get best returns
So on and so forth! One could have made the best returns if they had been invested in upswing Industries at any given point of time.
Note: Relative Momentum is a proprietary Indicator developed by InvestIn10. This indicator is at the core of most Technical analysis at InvestIn10. Pretty sure that Relative Strength can give similar returns.
Leave a Reply