We will look at how the Relative Strength of different Sectors in India behave during a typical Sector Rotation.
Definition of RS (Relative Strength): RS tells you in % terms, how much of a Measured Variable (chart) has changed w.r.t. the Reference Variable (chart), in a given duration.
Example: Quarterly RS of Stock A w.r.t. Nifty:
When you want to check Relative Strength of Stock A, w.r.t. Nifty, we set Nifty as the Reference Chart in the RS indicator, and set duration to Quarter (92 days ~= 63 trading days).
Imagine now, if Stock A, on Daily Chart interval, is showing Quarterly RS of 0.1 (today). This translates to Stock A exhibiting 10% (0.1) Out-performance when compared to Nifty for the duration of the previous 92 days (Quarter)
Below is the Quarterly Multi-RS of different Sectoral Indices of India w.r.t. Nifty
Sectors considered: Bank, IT, Auto, FMCG & Reliance (it’s a sector by itself!).
Each individual Sector’s RS is computed against Nifty in this chart, but for a duration of a Quarter.
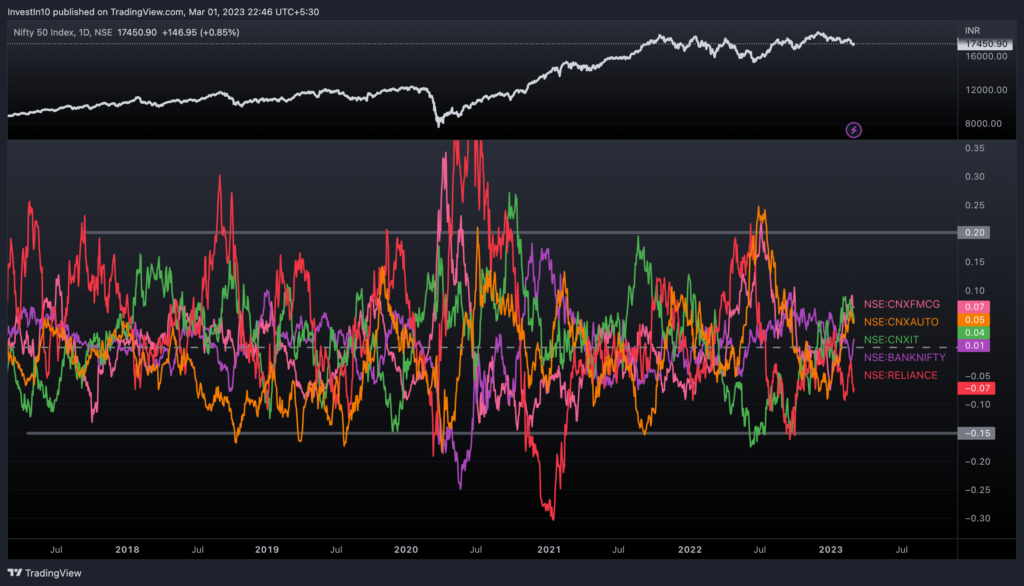
Inferences:
- A Sector, generally out-performs by max 20% (0.2) or under-performs by max 15% (-0.15), the Nifty: shown by the two Grey lines on the Chart.
- A Sector, after out-performing or under-performing the Nifty, generally revert to mean.
- It’s usually better not to Buy into a Sector when it is at its peak out-performance w.r.t. Nifty
- When a Sector is at it’s peak under-performance, it’s generally best suited for Long Term Investments – but this can result in multi-year underperformance, so not recommended.
- One of the key take-way is that none of the Sectors have peaked in either direction in the present scenario.
Let’s have a zoomed-in view of the Sectoral RS

From our previous Inferences arrived at by studying the 5 year Sectoral chart, can we take a guess on which Sector would out-perform the Nifty by 20% in the coming months?!
My Guess: FMCG, IT & AUTO
And, which Sector/Stock would under-perform nifty by 15% in the coming months?
My Guess: Reliance (Banks, if they don’t recover soon)
Leave a Reply