The Swing Screener page is not just screening Stocks, but also generating basic analytics which can help you become a better Swing Trader.
SWING-O-Meter
Tabulates the number of Swing Stocks selected every trading day. In effect, we will know easily when the odds of Swing trading are in our favour by just glancing at this line graph.

Higher number of Swing Stocks in the above line graph points to higher number of stocks in uptrend, and undergoing accumulation.
SWING-HEATMAP
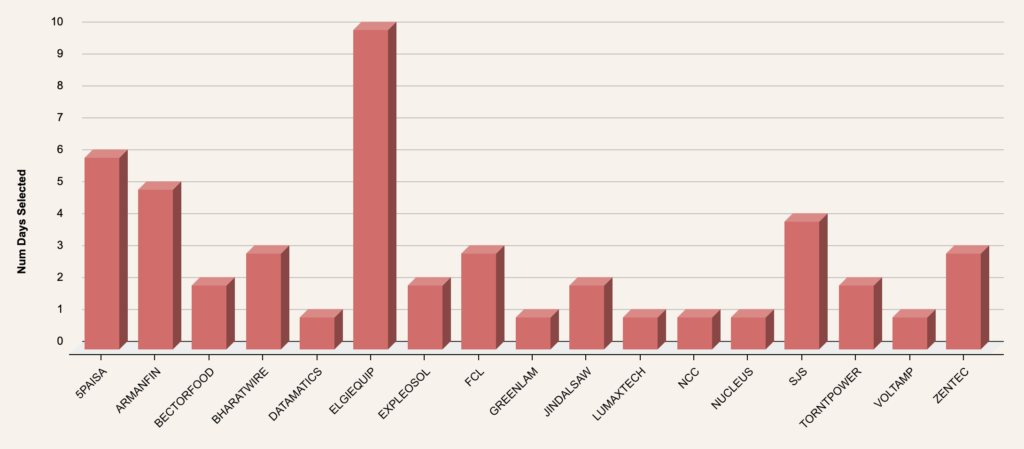
Calculates the Number of days the current Swing Stocks were selected, by looking back into 10 previous Trading Days.

Higher number of days in the above chart signifies that the Stock after coming into up-trend is spending time in accumulation zone. The higher number in the above chart, might / might-not be a good thing, and entirely depends on the kind of Bull market we are in.
Let’s say we are undergoing a pause in the Bull market and there is sideways Market movement, higher bars on the above chart signifies that the given Stock can be undergoing accumulation and is worth taking a look!
Historical List of Swing Stocks

This is an archive of the Stocks that were selected by the Swing Screener, for checking the stocks that could have been traded at a previous period of time. Best suited for post-mortem of a period of time.
The Swing Screener page is updated on a daily basis. This is my contribution for the Swing Trading Enthusiasts over there!

Leave a Reply